

Third Wave
A third wave of infections is underway in the UK. Case numbers are rising rapidly, particularly in Scotland and England. To date, as we previously highlighted, this has been a wave unlike those that came before. Vaccines mean much better protection for higher risk groups. Cases are concentrated primarily in the young, and there has been little impact on hospital numbers or deaths. Is that now beginning to change?
Accelerating Admissions
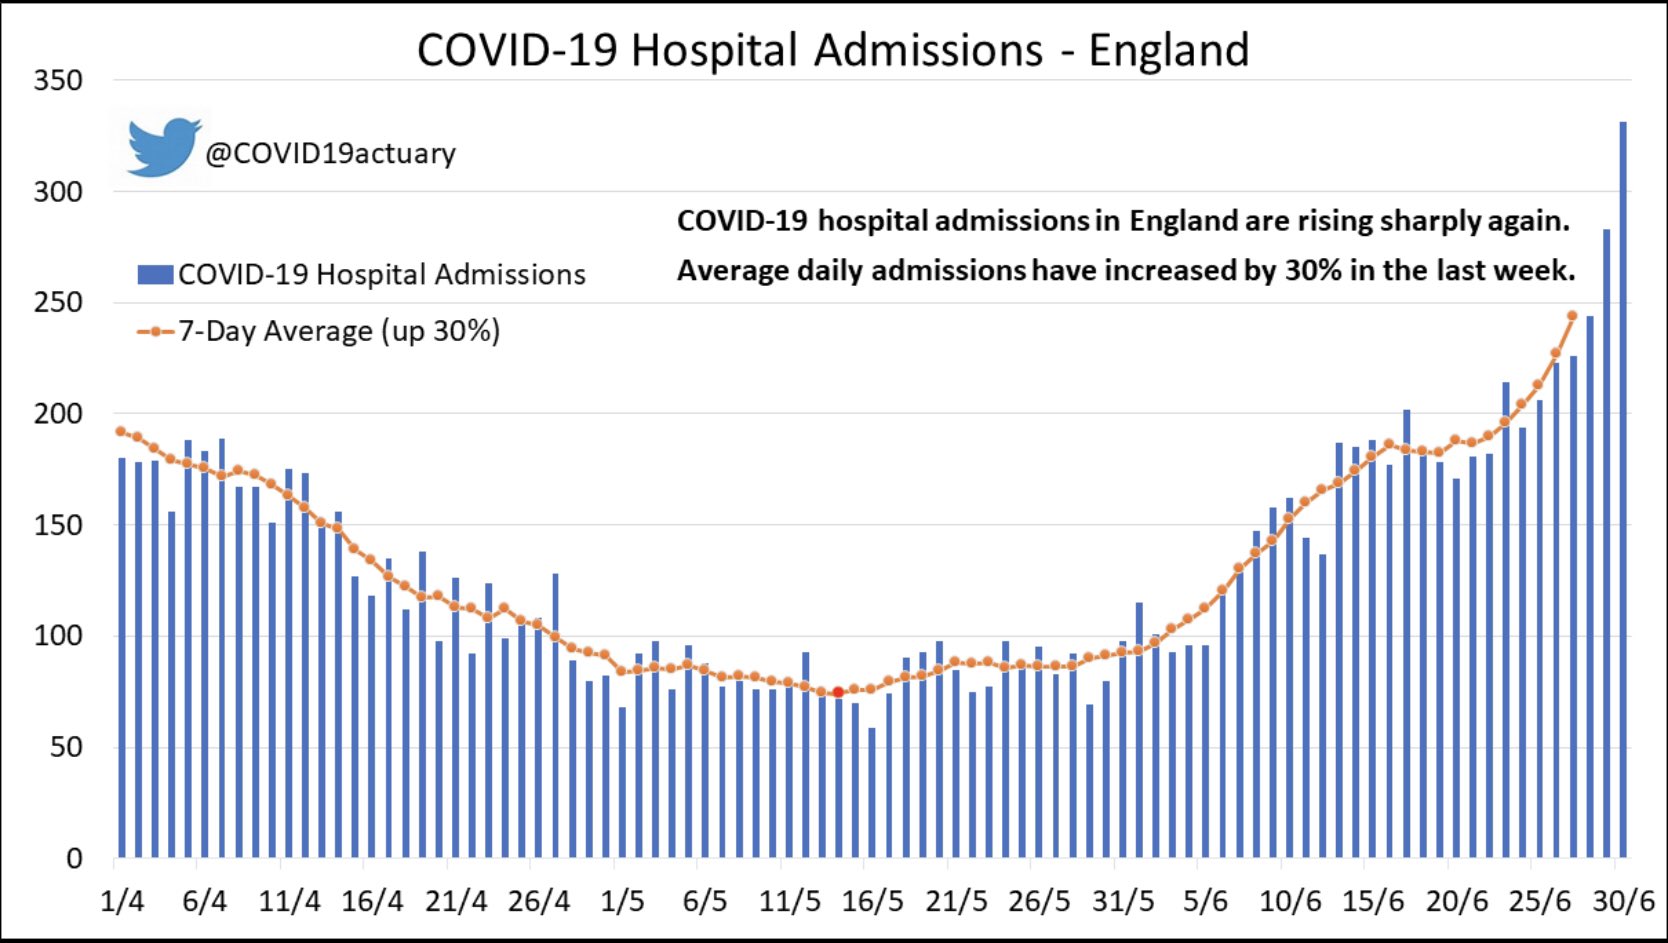
Daily hospital admissions in England have been increasing since mid-May. Indeed, this was one of the reasons why Step 4 of the roadmap was pushed back from 21 June (as we advocated here). In recent days the pace of increase has accelerated – average daily admissions increased by 30% over the past week.
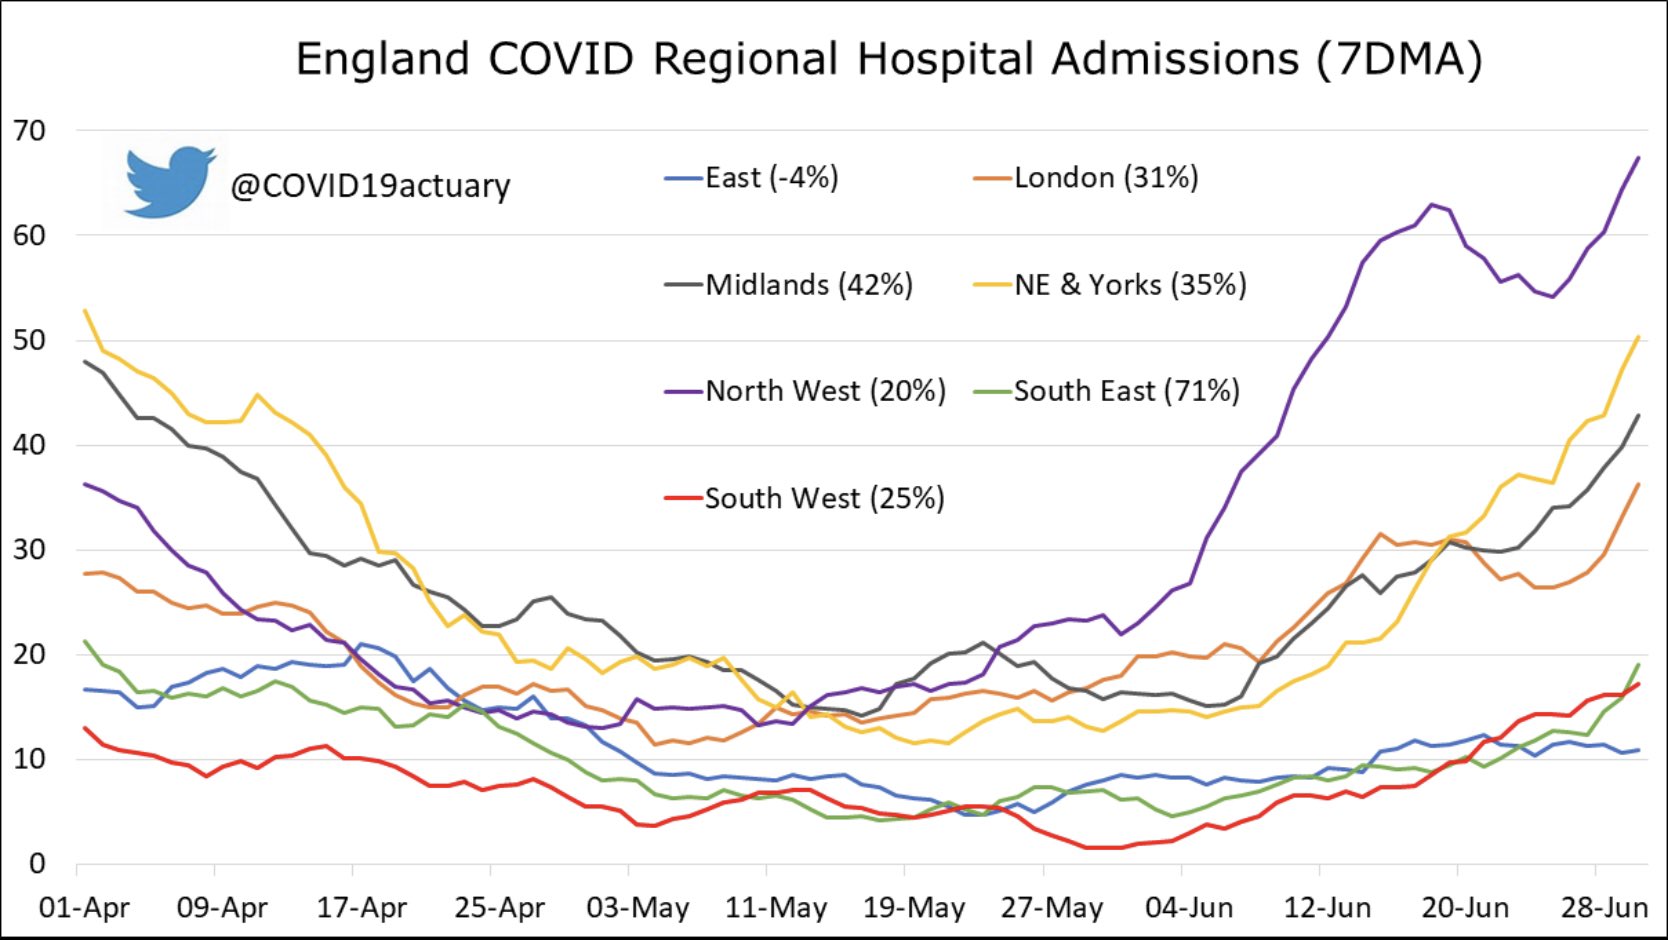
There is significant regional variation in both the level of daily hospital admissions, and the rate at which this is changing. Other than the East of England, all regions saw rapid growth over the past week. The North West has the most admissions, and these increased by 20% this week. The North East & Yorkshire, Midlands and London all have similar numbers, and all increased by 30-40%. There are fewer admissions in the East, South East and South West, though the South East saw admissions increase by over 70% this week.
Occupancy
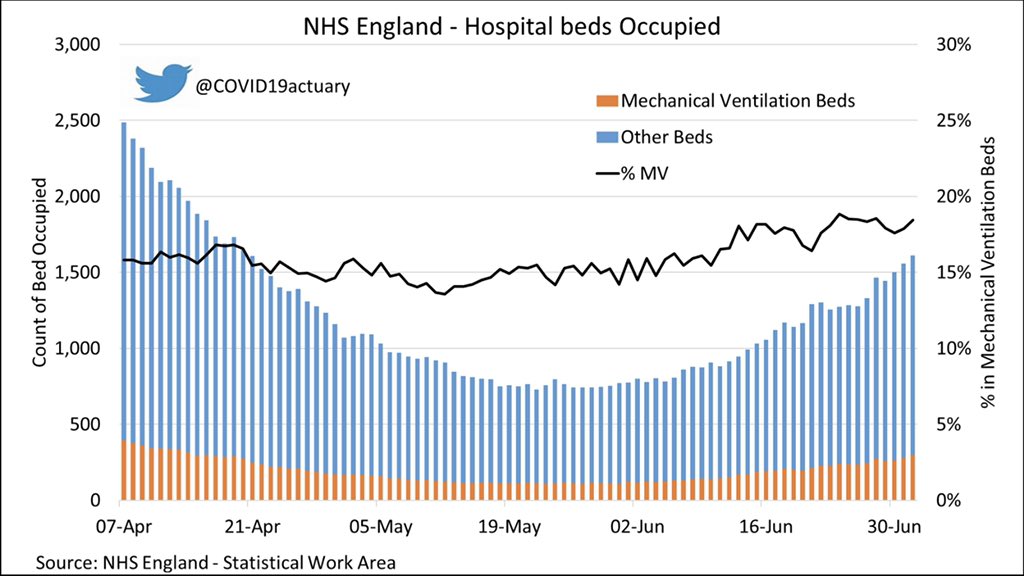
Hospital occupancy has risen more slowly than admissions. The chart below shows that bed occupancy began rising in late May. Like admissions, it has increased more rapidly in recent days. The proportion of patients in mechanical ventilation beds has also increased slightly. In the last week the total number of beds occupied increased by 25%.
Anecdotally it has been suggested that a higher proportion of admissions are less serious cases, requiring shorter stays. We do not have access to regularly updated data on severity or length of stay but can examine this question indirectly.
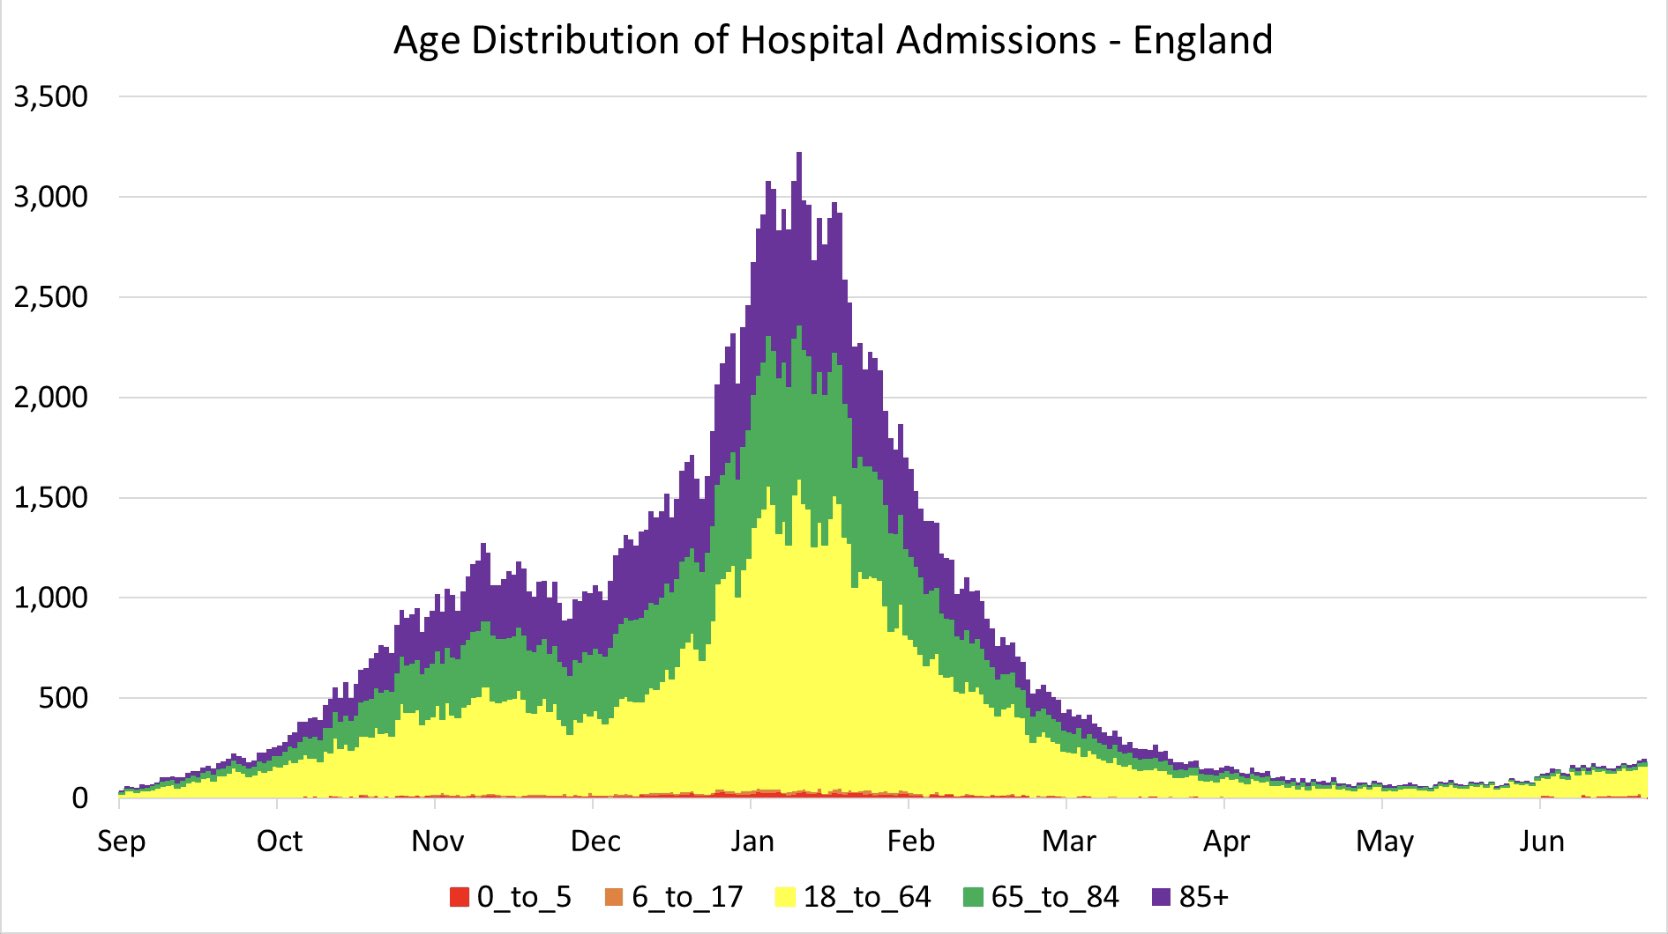
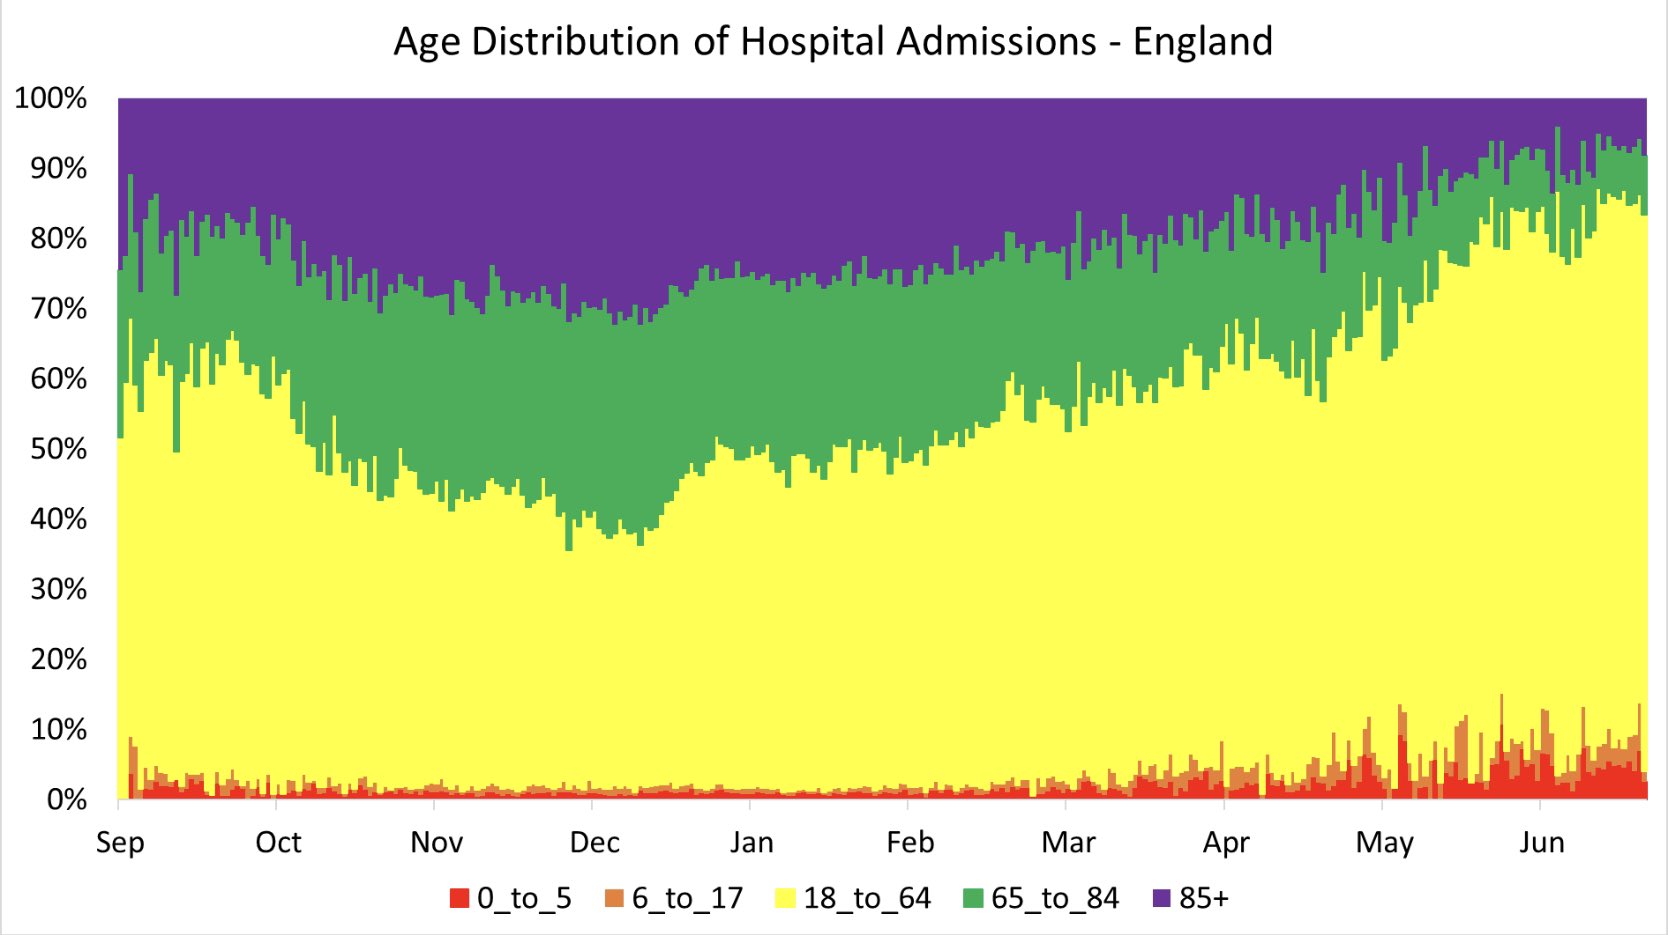
Age Distribution
We can examine the age distribution of admissions, although unfortunately daily NHS data uses very broad age bands. In particular, everyone aged 18 to 64 is grouped together. There is also no information on vaccine status. Nonetheless, it is clear that there has been a significant change to the age of the typical COVID patient admitted to hospital. Over the winter people aged 65 plus made up the majority of admissions. Now they are now a small minority, with the vast majority being those aged 18-64. This change is surely a consequence of the successful vaccine rollout, with most people in the oldest groups fully vaccinated. This lends strong support to the argument that more of the cases are less serious, requiring shorter stays.
(Edit – See our follow up for more granular analysis of admissions by age using ONS data)
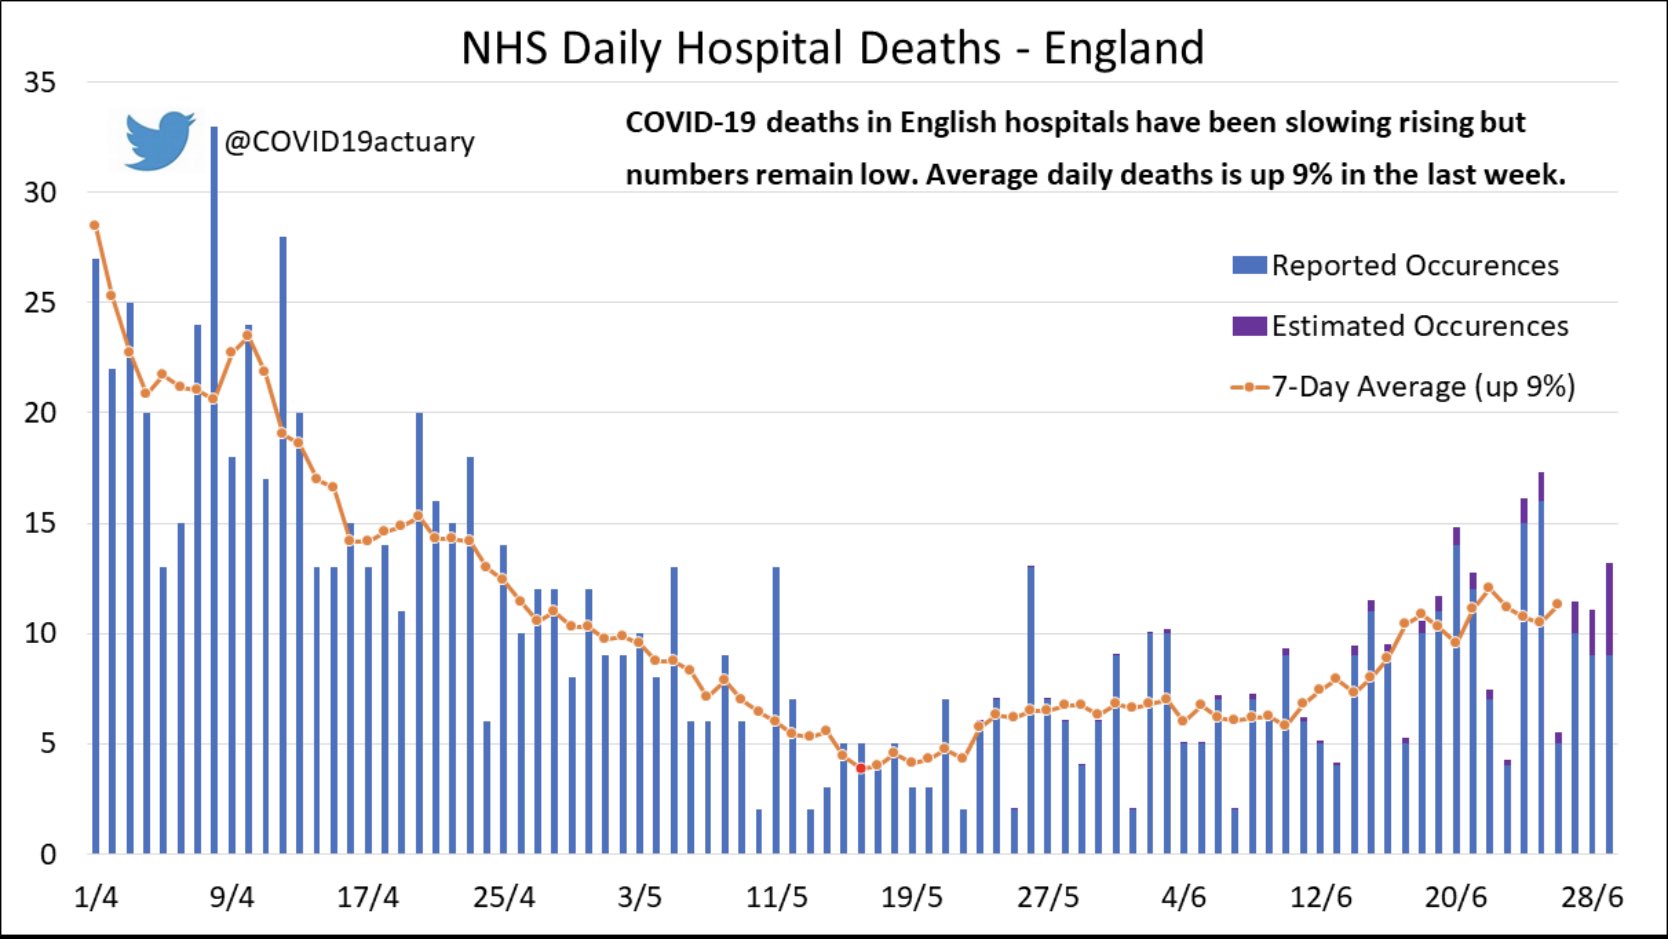
Hospital Deaths
Lastly, we can analyse deaths in hospitals. These too have been increasing since mid-May but the rate of increase is significantly slower than the rate of increase in cases, hospital admissions or beds occupied. The average has increased by 9% in the past week, but that is still “just” 11 deaths with COVID each day. The chart below is based on actual date of death (rather than date reported) and uses an actuarial method (described here) to estimate deaths in recent days which have not yet been reported. Even allowing for the lag between admissions and deaths, it is clear that COVID patients admitted to hospital are more likely to survive than at earlier stages of the pandemic.
How much further might hospital admissions, bed occupancy and deaths increase? At this stage that is difficult to predict. Infections are now much less likely to result in hospital admission, or death, but that might just mean that we tolerate more infections than in previous waves. Indeed, much of Scotland already has more cases than at any previous point in the pandemic. It has always been pressure on hospitals, rather than case numbers that has been the primary influence on UK Government decision-making.
Summary
It’s clear that it is no longer just cases which are increasing. Hospital admissions have risen sharply and, based on case numbers in the last week, are likely to continue to do so in the short term. How much further they could increase is difficult to predict at this stage.
The age profile of admissions is much younger than in previous waves and it looks like they result in shorter stays. Fewer admissions are resulting in deaths. We will analyse the emerging data closely over the coming week ahead of the announcement about Step 4 of the roadmap, planned for 19 July.