

Background
We have consistently advocated the use of excess deaths as the best measure of the direct and indirect impacts of the pandemic.
Excess deaths are calculated by comparing actual mortality to a reference amount, often referred to as a baseline or benchmark. For a fuller discussion on this see our blog from this time last year.
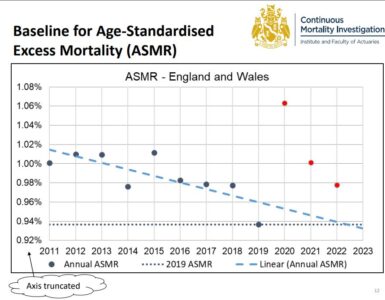
Each week, typically on Tuesday mornings, the Office for National Statistics (ONS) publish a count of weekly deaths along with a five year average as a point of comparison. The Continuous Mortality Investigation (CMI) use this death count data to calculate age-standardised mortality rates. These are summarised in their Mortality Monitor, which gives a more robust picture of how mortality compares to pre-pandemic.
I have been sharing the ONS data on social media as an early indicator of the level of mortality, until CMI analysis is available. Since these posts are sometimes viewed by large numbers of people it feels appropriate to satisfy myself that the baseline used is appropriate.
ONS Approach
Historically, ONS has compared deaths to the five preceding years, so in 2020 deaths were compared to 2015-19. In 2021 they chose to continue with a 2015-19 comparison rather than let the average be distorted by the exceptionally high number of deaths seen in 2020. In 2022 however they decided to move to an average of 2016, 2017, 2018, 2019 and 2021. The thinking was explained in this ONS blog. We’ve seen no formal ONS statement about their planned 2023 baseline. However, ONS Head of Mortality Analysis Sarah Caul has indicated that they will use the average of 2017, 2018, 2019, 2021 and 2022.
On the face of it this approach of including pandemic years feels problematic when there is so much interest in understanding how much the pandemic has, directly and indirectly, impacted mortality.
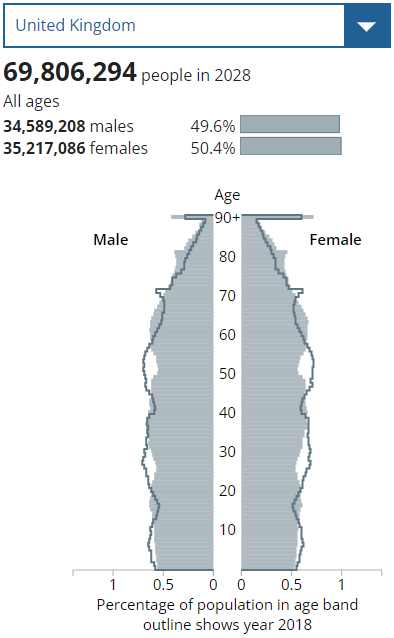
On this other hand, we have a rapidly increasing older age population which means that we should expect the number of deaths to increase each year. Population pyramids shows how the demographic profile is expected to evolve between 2018 and 2028 – we’re now half way through that period. Comparing deaths in 2023 to the 2015-19 average would significantly overstate the number of excess deaths as around 20,000 additional deaths are expected from demographic change alone.
To decide whether to present excess deaths against the ONS proposed baseline I considered other approaches for a 2023 baseline.
Rolling forward the 2015-19 average
The approach I considered in most depth was to take the 2015-19 average and project it forwards by three years allowing for the extent to which the population has aged and grown. Using CMI data I calculated that I would have to increase weekly deaths by 4.7%. This gives an approximate counterfactual for 2018-22 if there had been no pandemic.
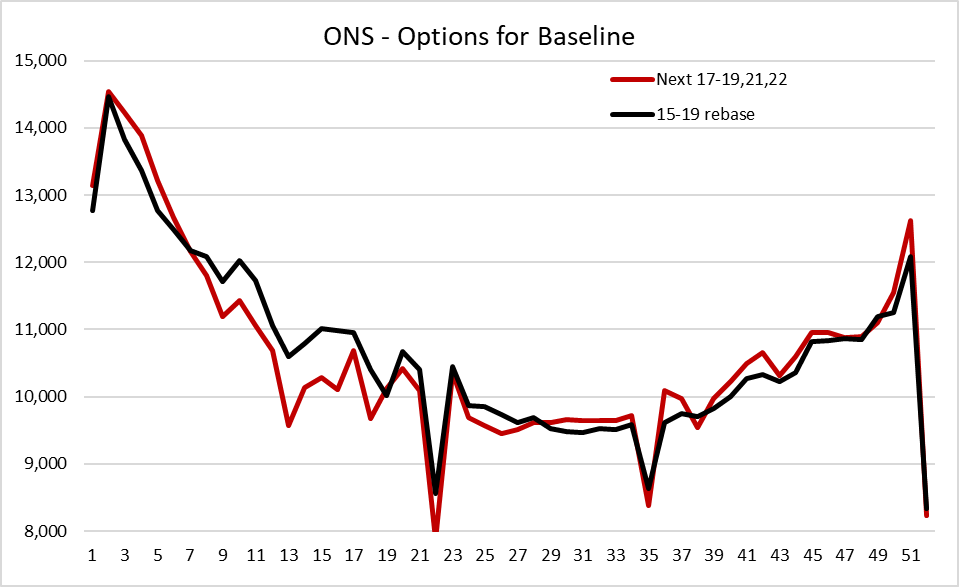
The chart below shows the difference between the two baselines. Reassuringly, both approaches gives a reasonably similar number of expected deaths in the year as whole. The average of (2017-19,21,22) gives 552,500 and the rebased 2015-19 average gives 556,100. That’s a difference of 0.7%.
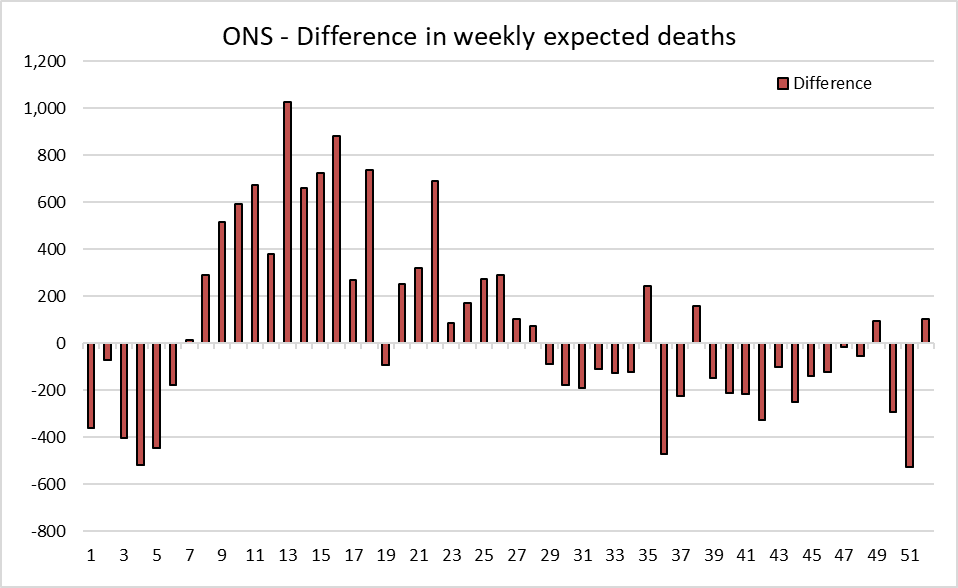
There are some fairly large differences in individual weeks, shown in more detail below. Relative to the alternative approach, the ONS baseline will tend to understate the excess in the first six weeks of the year and the second half of the year. This is because it includes the spike in deaths in 2021 and the chronic excess mortality seen in the second half of both 2021 and 2022. On the other hand, relative to the alternative approach, the ONS baseline will tend to overstate the excess between March and June.
Conclusion
Sticking with the 2015-19 average does not feel like a reasonable options for a 2023 baseline as a significant excess would arise from demographic change.
Overall, I am satisfied that, despite 2021 and 2022 including significant numbers of excess deaths, the shape of the ONS 2023 baseline and the number of deaths expected are reasonable. I will use the same five year average as ONS this year when discussing any excess of death counts. This should help avoid any confusion from taking different approaches.
Ultimately, the best way to calculate excess deaths is to determine age-standardised death rates. Hence, I still view the CMI Mortality Monitor as the gold-standard approach and best measure of excess deaths. This is typically available a few hours after the ONS data is released.