
Excess Deaths
Over the last two years discussion of excess deaths has entered the mainstream. It is no longer the preserve of actuaries and demographers. With the start of a new year, we thought it helpful to set out what we are aiming to measure when calculating excess deaths, and to discuss how the reference period can influence the result. We focus here on the UK but many of the comments are applicable more widely.
Excess deaths are always calculated by comparing actual mortality to a reference amount or benchmark. The best benchmark and method of calculation often depends on the precise question being answered. Here we assume that we are seeking to answer the question “what would deaths (from all causes) have been in the absence of the pandemic?”
Even in normal times mortality displays volatility from year-to-year. Hence it is typical to use a period of more than one year as a benchmark. This has the effect of smoothing the volatility. However, there are two key factors that make use of a longer period problematic: the ageing population and improving mortality.
Ageing Populations
Like many countries the UK has an ageing population. This is partly because of historical increases in life expectancy, but also because those born during the baby boom of the 1950s and ’60s are now into or approaching their retirement years. The increasing number of older people means that even if death rates were exactly the same (at all ages) each year, we would see more deaths year-on-year. In the UK the increase would be 1.5% to 2% each year.
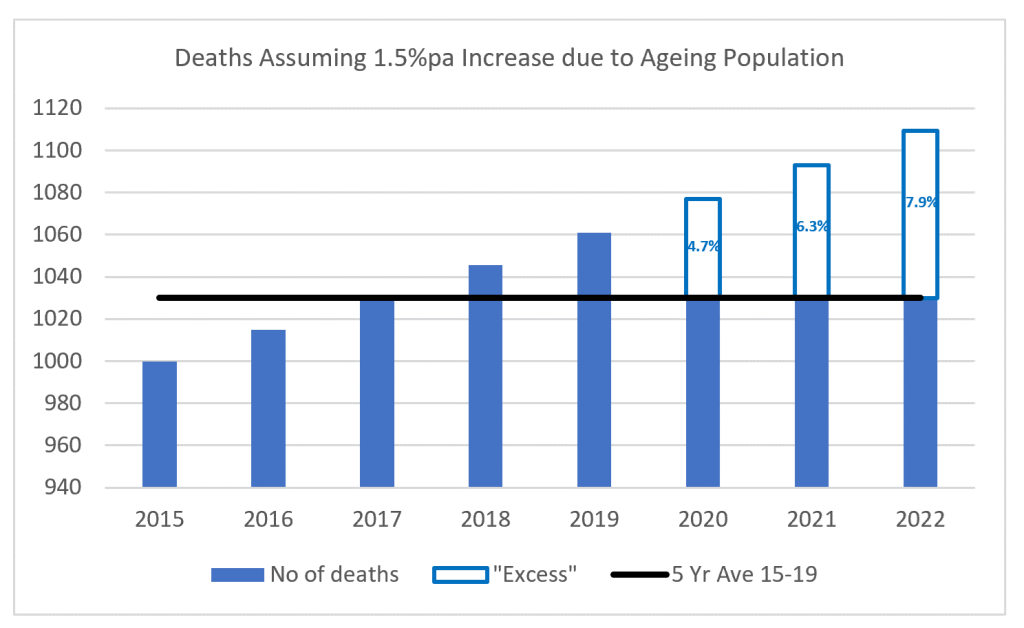
When the number of deaths is increasing each year, a calculation which simply compares the number of deaths this year to a historical average will overstate excess mortality. That’s just basic arithmetic. The example below assumes deaths are increasing by 1.5% each year as a result of the ageing population. It can be seen that deaths in 2020 would be expected to exceed the 2015-19 average by 4.7% even if death rates are unchanged. With every year that the 2015-19 average remains in use the number of excess deaths expected increases, reaching 7.9% in 2022.
The Office for National Statistics (ONS) take this simple approach in their weekly deaths releases but they use alternatives in other publications such as their monthly mortality analysis.
The best way to address the problem described above is to use an age-standardised calculation. This automatically adjusts for changes in population size or age distribution. This is a standard method used by demographers and others involved in mortality research.
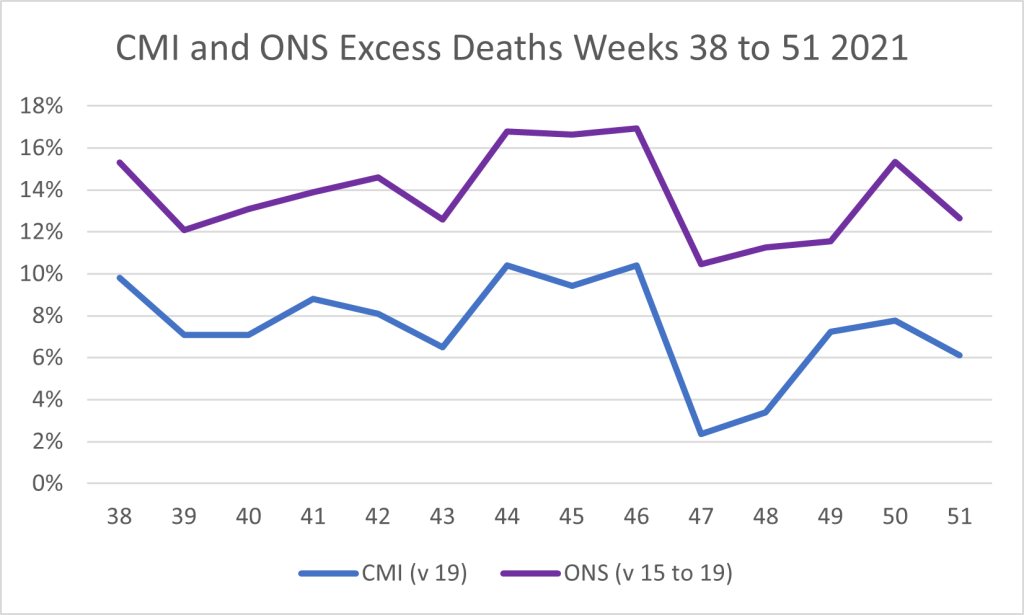
The Continuous Mortality Investigation (CMI) use an age-standardised approach in their Mortality Monitor publications. During 2021 its analysis typically produced excess mortality figures around 6% to 7% lower than the weekly ONS data produced, consistent with the above example.
Improving Mortality
There is a long history of mortality improvement in the UK. That is, death rates tend to fall over time resulting in increases to life expectancy. The rate of increase was low in the past decade by historical standards, but death rates were still falling.
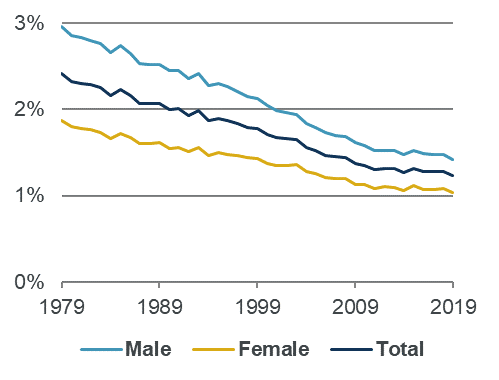
Improvements in mortality have the effect of reducing deaths year-by-year. This means that comparing back to a historical period is likely to overstate our view of expected mortality, and thus understate any level of excess. This is in contrast to the ageing population effect described above.
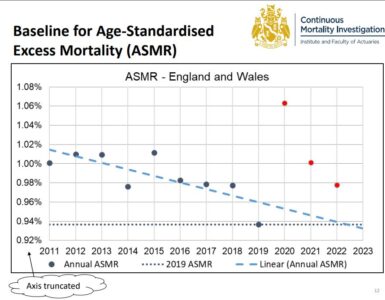
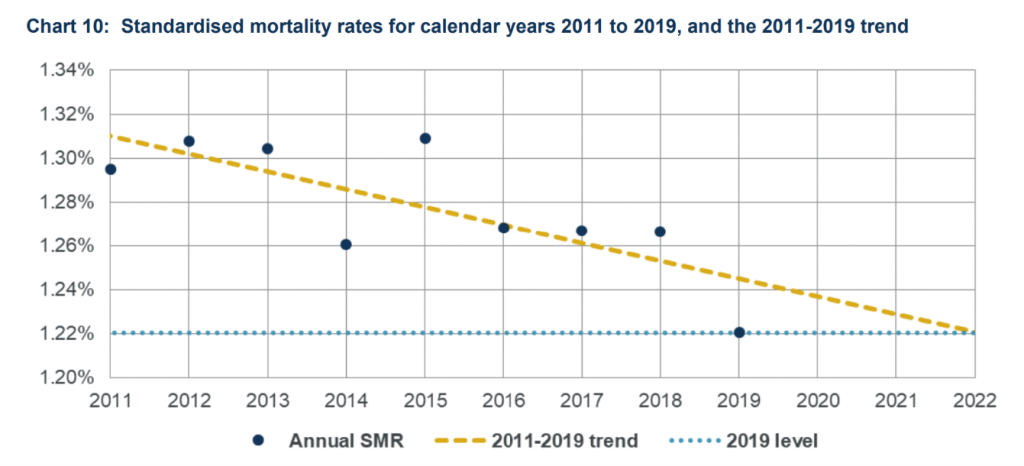
From a purely technical point of view the ideal benchmark would not just allow for historical changes to the population and mortality, but anticipate those that would have happened in the current year. Of course, any assessment of how mortality might have continued to improve in the absence of the pandemic is subjective, and thus open to debate. In the latest CMI pandemic update, we can see below how the trend has been improving since the start of the decade. The yellow dashed line is an estimate of the underlying 2011-19 trend in mortality rates, projected forward after 2019.
CMI Benchmark
The CMI have used 2019 as their benchmark throughout the pandemic. Recently they announced that they will continue to do so in 2022. We can see from the chart above that using a 2015-2019 average would have overstated expected mortality (and thus understated any excess). This is more of a concern when using an age-standardised approach (as the CMI do) than when using death counts. When using death counts (as the ONS do) the effects of the ageing population and improving mortality work in opposite directions, cancelling one another out to an extent.
Absent other information it could be argued that a 2019 benchmark might have overstated excess deaths in 2020 since 2019 mortality rates were below trend. In practice, 2020 mortality rates were tracking in line with 2019 for the first 11 weeks of the year, where most volatility typically arises, so CMI chose to use 2019 as its benchmark.
Moving on a year, we see that using 2019 as a benchmark for expected mortality in 2021 was likely to have been a close match. And extending still further suggests that 2019 is likely to be a very good benchmark for mortality in 2022.
Continuing to use 2019 has the benefit of consistency across all three years, and implicitly allows for improvement as 2019 was below the trend line.
ONS Benchmark
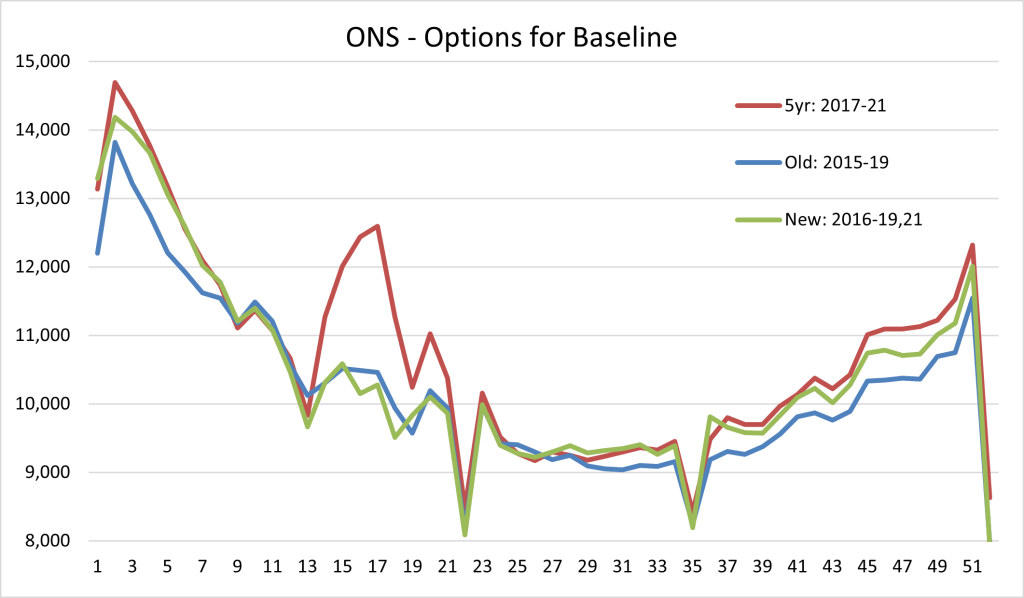
The ONS is continuing to use a five year average as its comparator in 2022 and has chosen to use 2016-19 and 2021 as the five reference years. A recent ONS blog describes their rationale.
There is no perfect solution if the aim is to try and be relatively up to date, yet avoid the distortions brought about by the pandemic, and the option chosen is a reasonable approach, if slightly unexpected.
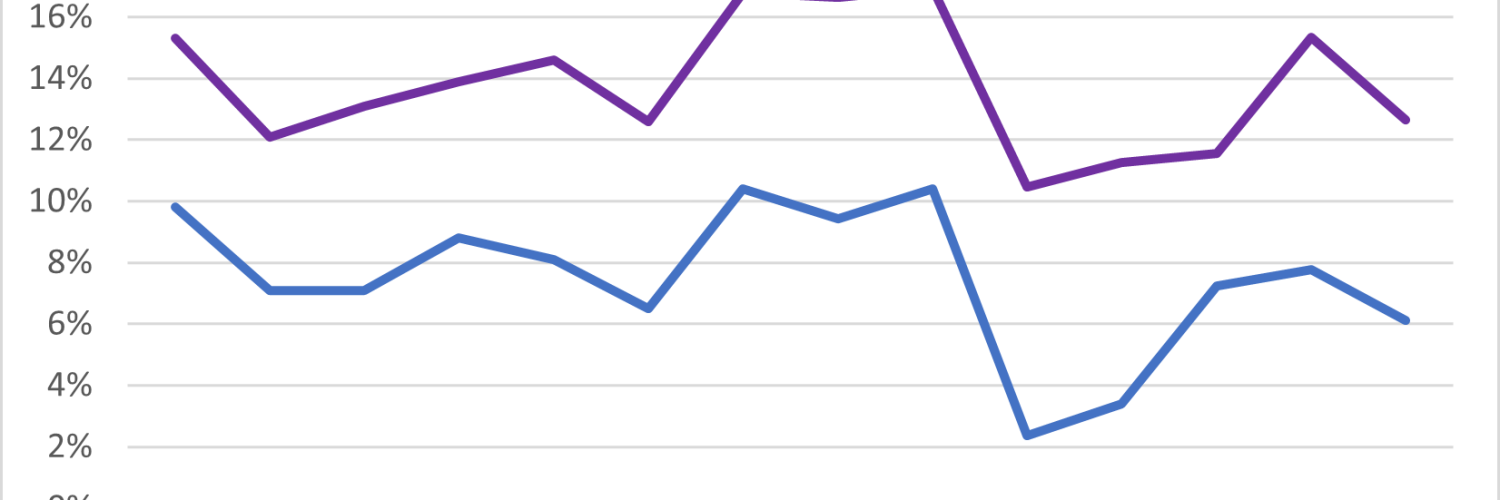
Including 2021 in the average (green line) means there will be some distortion, most notably in the first few weeks of the year, when the second wave resulted in a very large number of deaths. However, the distortion is nothing like as bad as if the 2017-21 average were used (red line). Nonetheless, this is a significant decision. The new baseline will mean 11,000 fewer calculated excess deaths for 2022.
Conclusion
Excess death calculations can be used to attempt to understand current mortality in comparison with experience pre-pandemic. The further we move from the reference period the more difficult it becomes to judge what mortality might have been this year. No benchmark will be perfect.
We have been consistent in our view that an age-standardised approach is preferable when calculating excess deaths. Absent the pandemic we might have expected mortality in 2022 to be reasonably similar to 2019. Hence the CMI approach – continuing to use 2019 as its comparator – remains our preferred method for assessing any excess mortality in 2022.