

We are pleased to provide an updated summary of the splits of Delta variant cases and hospitalisations by vaccination status. This is possible thanks to the rapid release of data by Public Health England (PHE) in Technical briefing 19 of their “SARS-CoV-2 variants of concern and variants under investigation in England” series.
The case and hospitalisation data comes from the period 1 February to 19 July. 45% of Delta cases tested positive in the last 28 days. We compare the splits of cases and hospitalisations from the PHE report with vaccination take-up rates in England as at 14 June 2021. Vaccine take-up information comes from the UK government coronavirus dashboard and is compared with mid-2020 population estimates.
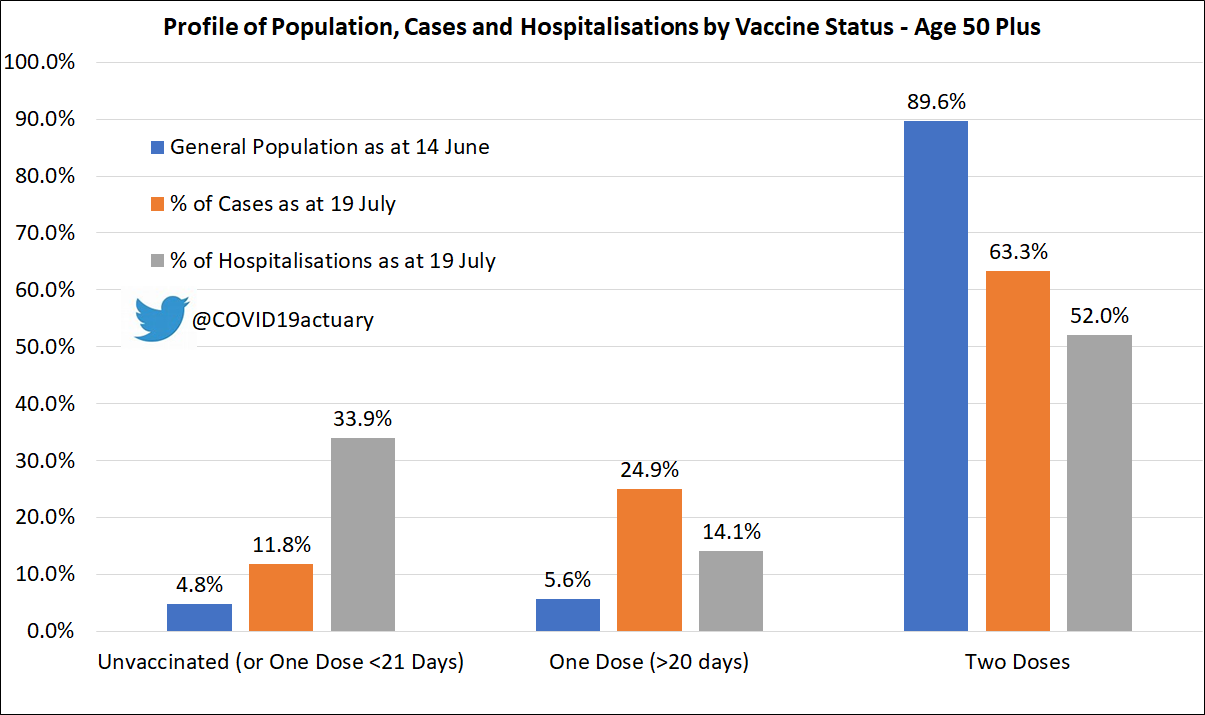
The graphs below show that the unvaccinated (including the very recently vaccinated) are disproportionately likely to test positive for COVID and to require hospital admission. The reverse is true among the fully vaccinated.

We can compare the likelihood of hospitalisation in each group to help understand the real-world effectiveness of the vaccines.
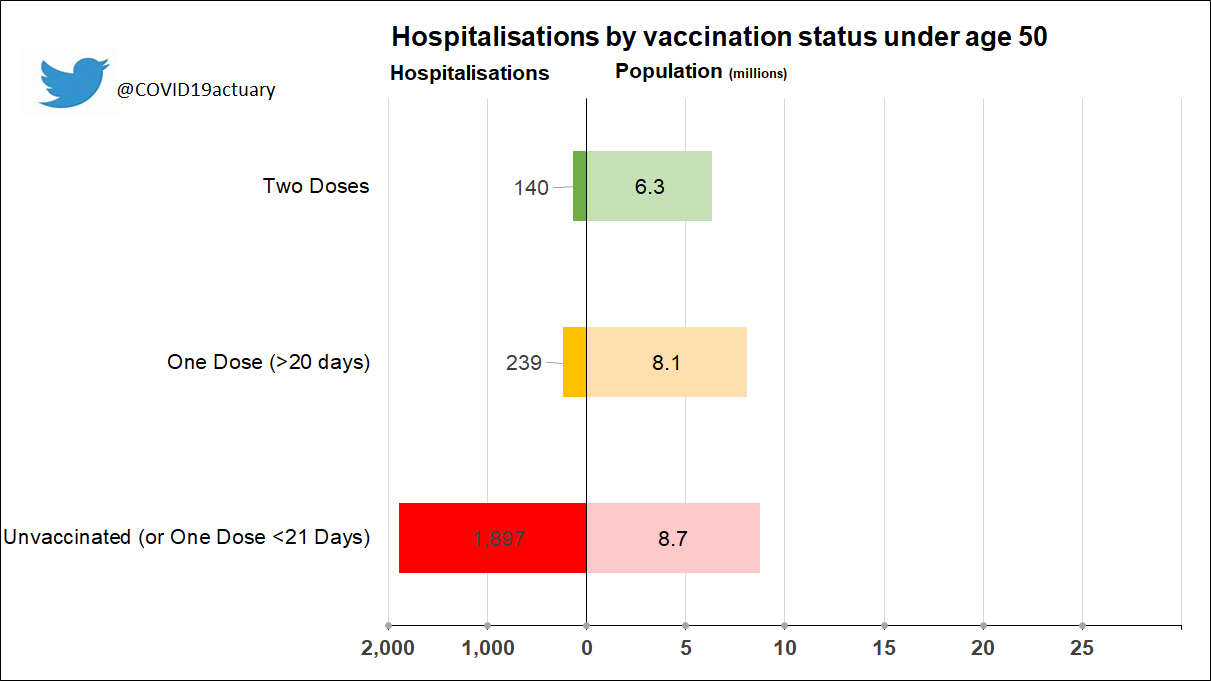
•For the under 50s, we can see that 38% of the population is unvaccinated but they make up 83% of admissions. Meanwhile, 27% of the population is fully vaccinated but they make up just 6% of admissions. This tells us that the risk to unvaccinated people under 50 is around 10 times higher* than the risk to vaccinated people.
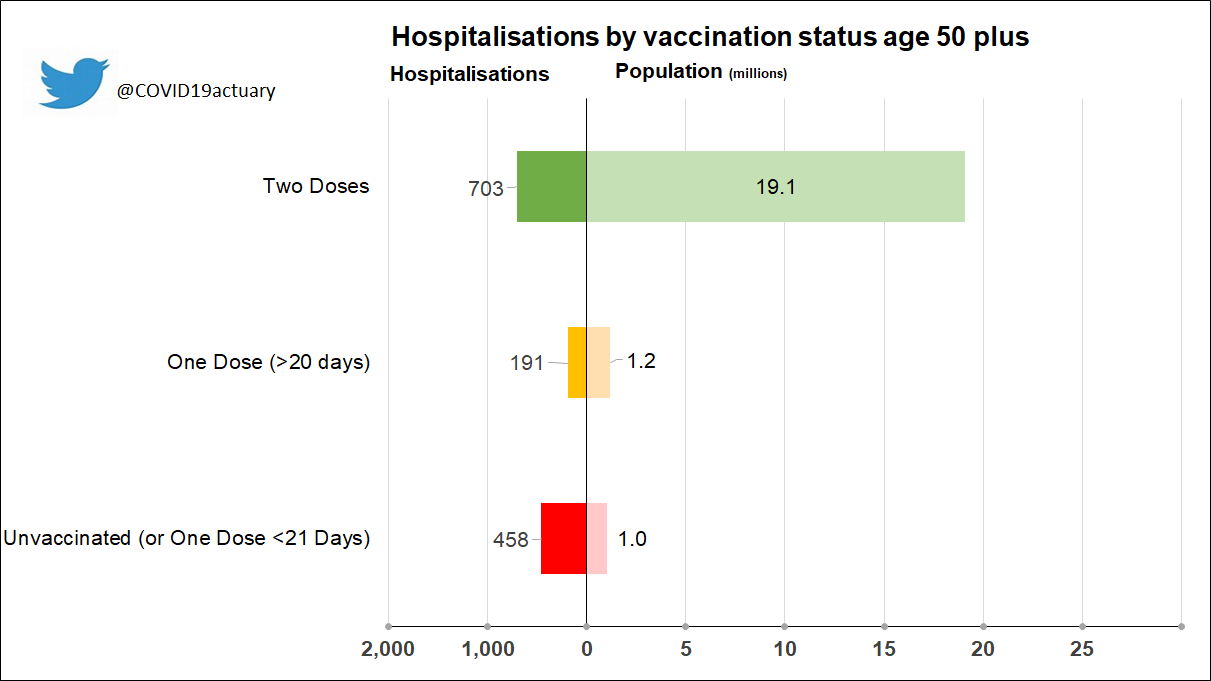
•For those aged 50 plus, we can see that just 5% of the population is unvaccinated but they make up 34% of admissions. Meanwhile, 90% of the population is fully vaccinated but they make up 52% of admissions. This tells us that the risk to unvaccinated people over 50 is around 12 times higher* than the risk to vaccinated people.
Another way of visualising difference by vaccination status is to compare the absolute numbers of hospitalisations against the size of the population. The next two graphs show that, for all age groups, the hospitalisations bar is longer in relation to the size of the unvaccinated or recently first-dose vaccinated population, while the hospitalisation bar is relatively short in relation to the size of the vaccinated population.
As explained in our original blog, even in a fully vaccinated population, COVID-19 hospitalisations will not be eliminated entirely because, while the vaccine highly effective, it is not 100% effective. It is essential to allow for the proportion of the population that has been vaccinated, as well as age and co-morbidity profiles before drawing conclusions.
As demonstrated again here, with results consistent with our previous analysis, the unvaccinated run a significantly higher risk of hospitalisation than the vaccinated.
* The real-world effectiveness calculation used here is (83.3% / 37.7%) / (6.2% / 27.4%) = 9.8 for the under 50s and (33.9% / 4.8%) / (52.0% / 89.6%) = 12.2 for the 50 plus group.