

Simpson’s Paradox
Simpson’s Paradox is when a relationship appears within individual groups of data but disappears or reverses when the groups are combined.
A classical example of Simpson’s Paradox is currently doing the rounds on social media.
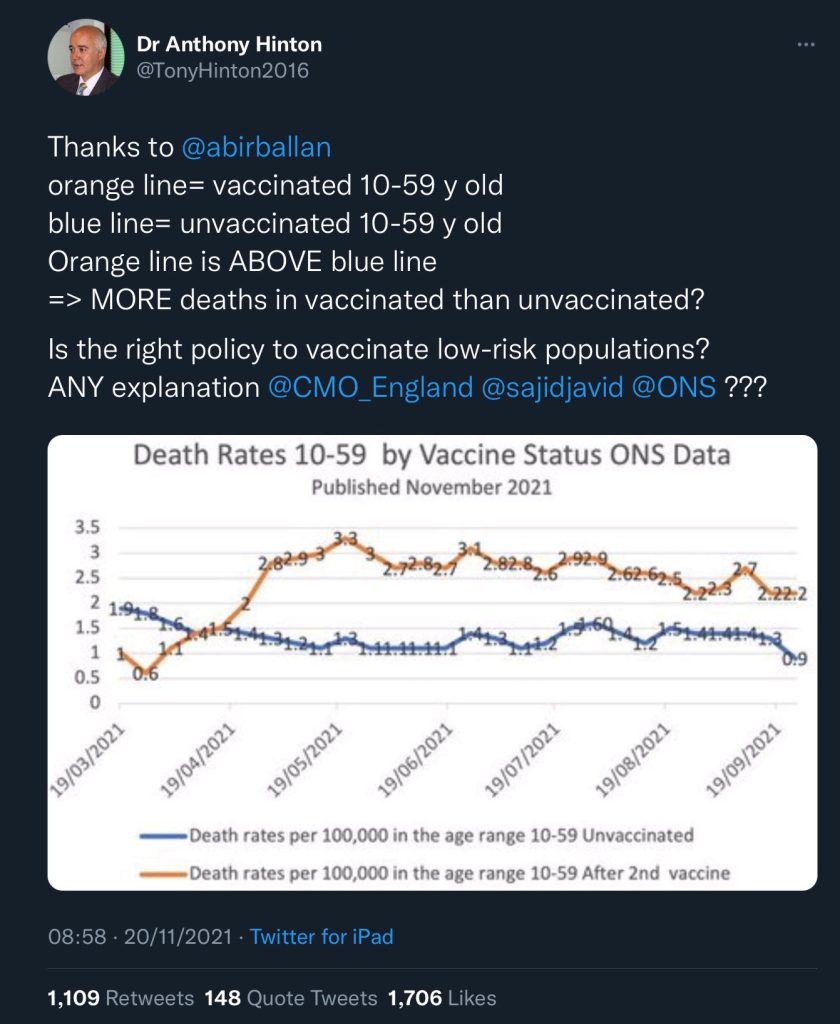
The chart above shows all-cause death rates for vaccinated people aged 10-59 are significantly higher than for unvaccinated people in the same age group. What looks at first like it might be an outright lie or error is in fact based on real data released earlier this month by the Office for National Statistics. The data is in Table 4 of the data spreadsheet.
At first glance the chart above is worrying. It’s unsurprising that it is being widely shared by those with concerns about vaccine safety (as well as those seeking to mislead those with such concerns). So what is really going on?
Explanation
There are two problems with the very broad age band (ages 10-59) used in this analysis.
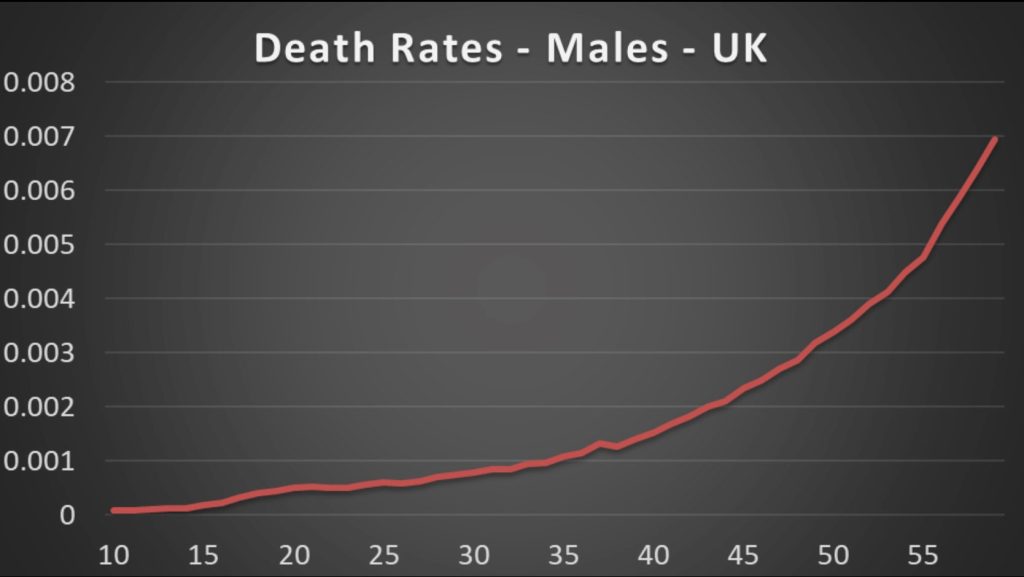
Firstly, death rates increase significantly with age. Death rates at age 59 are between 70 and 90 times higher than at age 10.
Secondly, vaccine uptake varies significantly with age. Vaccination rates are very high among those in their 40s and 50s in the UK. However, very few children and teens have had two vaccine doses. A second dose has only just been approved for those aged 16 and 17. Vaccines have not currently been approved for use in the UK for children younger than that.
So what the chart in the tweet linked above is really showing is that, within the 10-59 age band, the average unvaccinated person is much younger than the average vaccinated person. Therefore they have a lower death rate. Any benefit from the vaccines is swamped by the increase in all-cause mortality rates with age.
Illustration
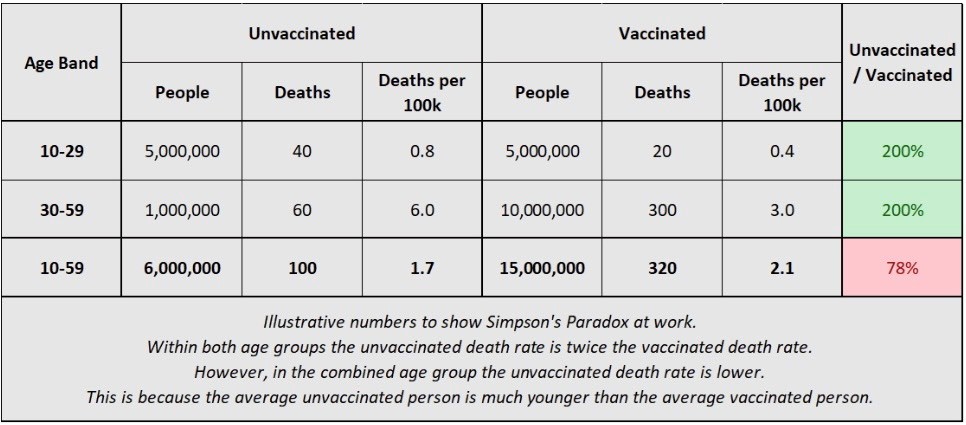
I have mocked up some illustrative numbers in the table below to show Simpson’s Paradox in action. I’ve split the 10-59 age band into 10-29 and 30-59. Within each group the death rate for unvaccinated people is twice as high as for vaccinated people. However, within the combined group this reverses – the vaccinated group have higher death rates on average!
I have written to ONS, alerting them to the concerns that this data is causing. It appears from a new blog that they are aware of the issue and will use narrower age bands in the next release.
Update
Pleasingly, I have now received an email from ONS confirming that I was correct about the cause of this issue. They will address this in the next release.
“We are going to publish monthly figures for more detailed age groups, as well as weekly figures that will be age adjusted. The differences is indeed driven by unvaccinated people being much younger on average.”
Further Update
The Office for Statistics Regulation has written to the ONS in respect of the issue described in this blog (and also about the headline finding in the report).
“…more should have been done to address the risk that the additional data could mislead people, specifically arising from the wide 10 – 59 age band.”
Podcast
I had the pleasure of discussing this saga with Tim Harford on More or Less for the BBC World Service. You can listen to our chat here (8 minutes).
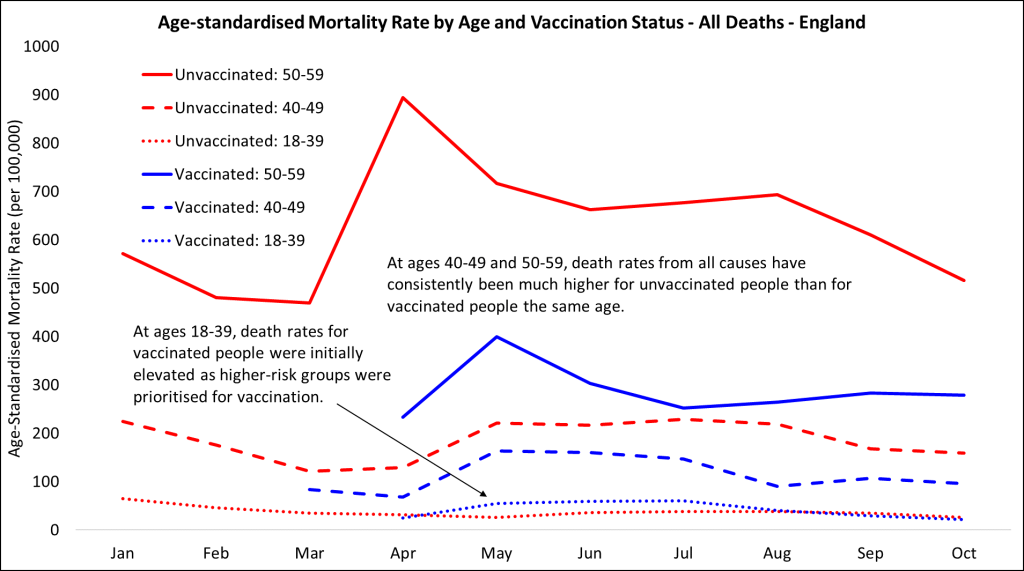
Updated Data
ONS have now updated their report on deaths by vaccine status.
The chart below uses data from Table 7 of the updated data spreadsheet, Using narrower age bands it is now clear that age-standardised mortality rates are much higher for unvaccinated people than for people in the same age band who have had two vaccine doses. At ages 50-59 the all-cause mortality rates for the unvaccinated are more than double those for the vaccinated! The only exception to the rule is early in the vaccine programme when the death rate for vaccinated people aged 18-40 was higher than for unvaccinated people in the same age group. This is because only high-risk groups had received two vaccine doses at that time.